Using PhpStorm’s Docker Integration to Debug PHP Apps Without Leaving the IDE
Learn how PhpStorm’s Docker integration lets you run, debug, and edit PHP code inside containers without leaving the IDE, plus the trade‑offs to watch for.
20 Sept 2026, 22:43 UTC
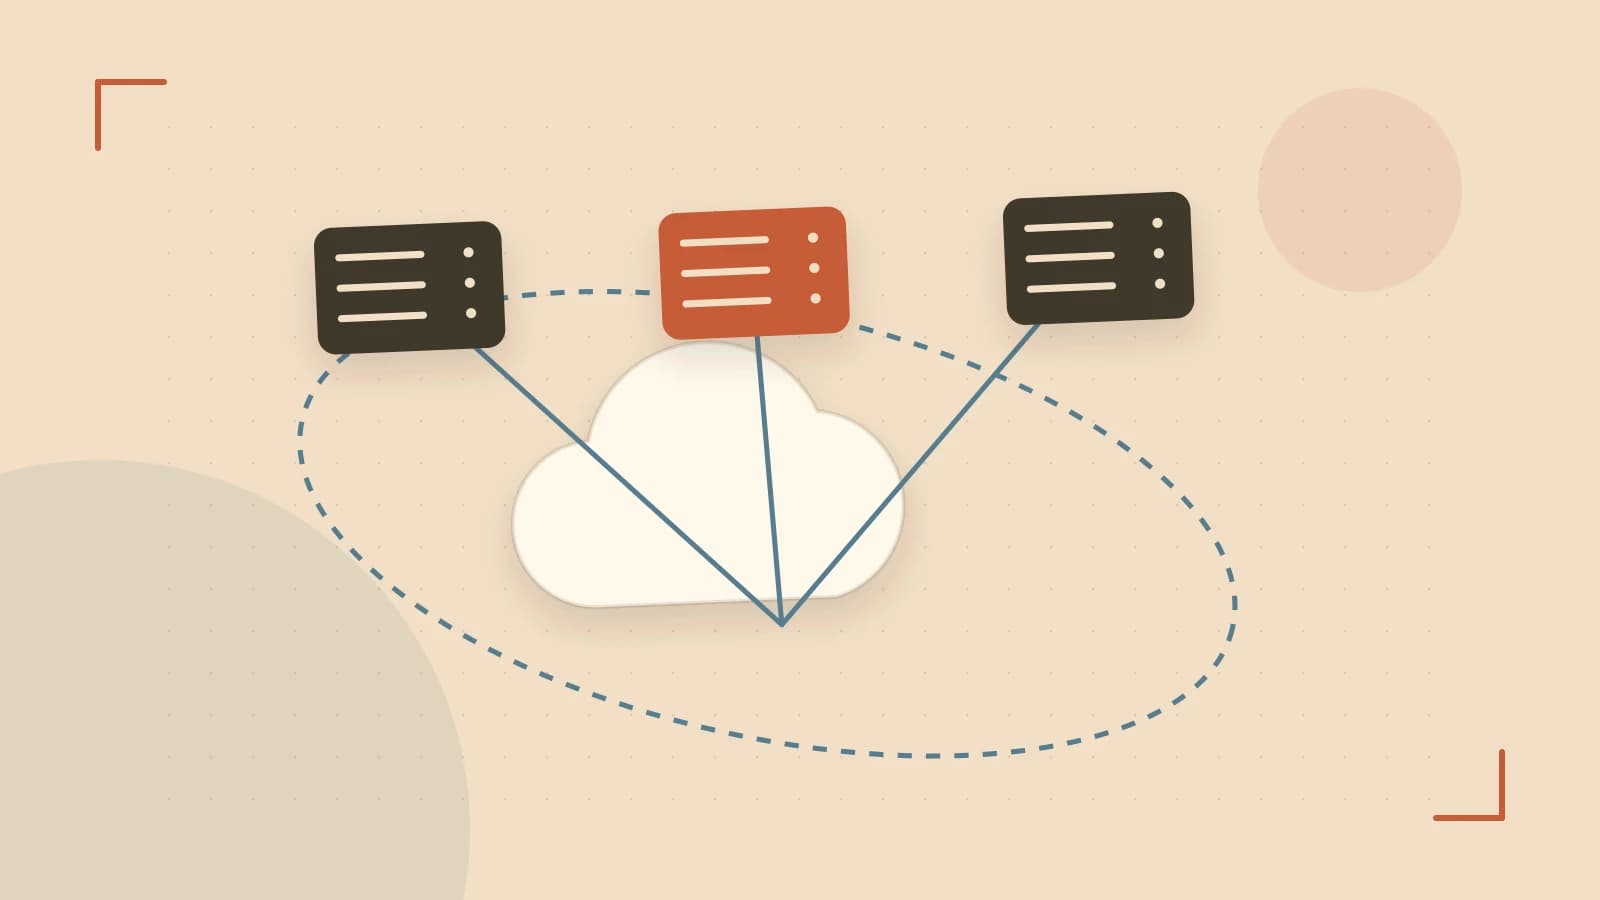
The problem: switching between terminal and IDE hurts flow
When a PHP project relies on Docker for services like a web server, database or queue, developers often spend time jumping to a terminal to start containers, check logs, or rebuild images after a code change. This context switch breaks concentration and makes iterative debugging slower.
Thesis: PhpStorm’s built‑in Docker plugin can host the PHP interpreter inside a container, stream logs, and forward ports so you can edit, run, and debug entirely from the IDE.
1. Preparing the project for Docker detection
PhpStorm automatically looks for a Dockerfile or docker-compose.yml in the project root. If either file is present, the IDE offers to create a remote PHP interpreter based on the container.
- Open the project in PhpStorm.
- Ensure Docker Engine is running and your user can access the Docker socket (e.g., you are in the
dockergroup on Linux). - Place a minimal
Dockerfilethat installs PHP and enables Xdebug, for example:
FROM php:8.2-apache
RUN pecl install xdebug && docker-php-ext-enable xdebug
COPY . /var/www/html/
EXPOSE 80
If you prefer Compose, add a docker-compose.yml that mounts the source code as a volume:
version: '3.8'
services:
  app:
    build: .
    volumes:
      - .:/var/www/html:cached
    ports:
      - "8080:80"
    environment:
      - XDEBUG_MODE=debug
      - XDEBUG_CLIENT_HOST=host.docker.internal
2. Configuring the remote PHP interpreter
Once the Docker file is detected:
- Open Settings → PHP → CLI Interpreter.
- Click the + button, choose From Docker, Vagrant, VM, WSL….
- Select the
Dockerfile(or the service from Compose) and let PhpStorm build the image. - After the build finishes, the IDE lists the container as a valid PHP interpreter. Choose it and apply.
No manual docker run command is needed; PhpStorm starts the container whenever you run a PHP CLI script or a web request through the built‑in server.
3. Debugging with Xdebug inside the container
Breakpoints work when the IDE can map host paths to container paths.
- In Settings → PHP → Debug, ensure Xdebug is enabled and set the debug port (default 9003).
- When you create a Docker run configuration (Run → Edit Configurations → + → Docker), PhpStorm automatically adds the required
-e XDEBUG_CONFIG=client_host=host.docker.internalflag if you filled the environment variables in the Compose file. - Set a breakpoint in any PHP file, start the configuration with the debug icon, and make a request (e.g., open
http://localhost:8080in a browser). The IDE will pause at the breakpoint, showing the call stack and variables.
Because the source directory is mounted as a volume, any edit you make and save (Ctrl+S) appears instantly inside the container—no image rebuild or container restart is required.
Trade‑off and limitation
The convenience comes with two practical considerations:
- Resource usage: Running the IDE’s indexer and inspectors inside a container can consume noticeable CPU and RAM, especially on machines with limited resources. If you notice sluggish autocomplete, consider disabling IDE indexing for the
vendordirectory or allocating more memory to Docker Desktop. - Limited visualisation of advanced Docker features: Multi‑stage builds, BuildKit secrets, or complex health‑check definitions are not displayed in the PhpStorm UI. For those cases you still need to inspect the Dockerfile or run
docker compose configfrom a terminal.
How to verify the setup works
- Check the interpreter: Settings → PHP → CLI Interpreter should show the container image name and report a valid PHP version.
- Run a simple CLI script (
php -v) via Run → Run… and confirm the output appears in the IDE console. - Set a breakpoint, start the debugger, and trigger a request. The IDE should suspend execution and display the Variables pane.
- Edit a PHP file, save, then refresh the browser. The change should be reflected without rebuilding the image.
If any of these steps fail, verify that Docker is running, that the user has permission to access the Docker socket, and that the path mapping in the Docker run configuration matches the container’s working directory (/var/www/html in the examples).
Actionable closing
Start by adding a Dockerfile or docker-compose.yml to your project, let PhpStorm detect it, and configure the remote interpreter. Test the flow with a breakpoint and a live edit. If you hit performance slow‑downs, tune Docker resources or exclude large vendor folders from indexing. Once the loop is tight, you’ll spend less time juggling terminals and more time writing code.
 docker
 phpstorm
0 replies
A thoughtful contribution can make all the difference. Be the first to share one.