Tail Sampling in the OpenTelemetry Collector: Keep the Traces That Matter
Head sampling drops traces before knowing if they matter. Tail sampling in the OpenTelemetry Collector waits for the whole trace -- here's how to configure it and what it costs.
09 Aug 2025, 13:10 UTC
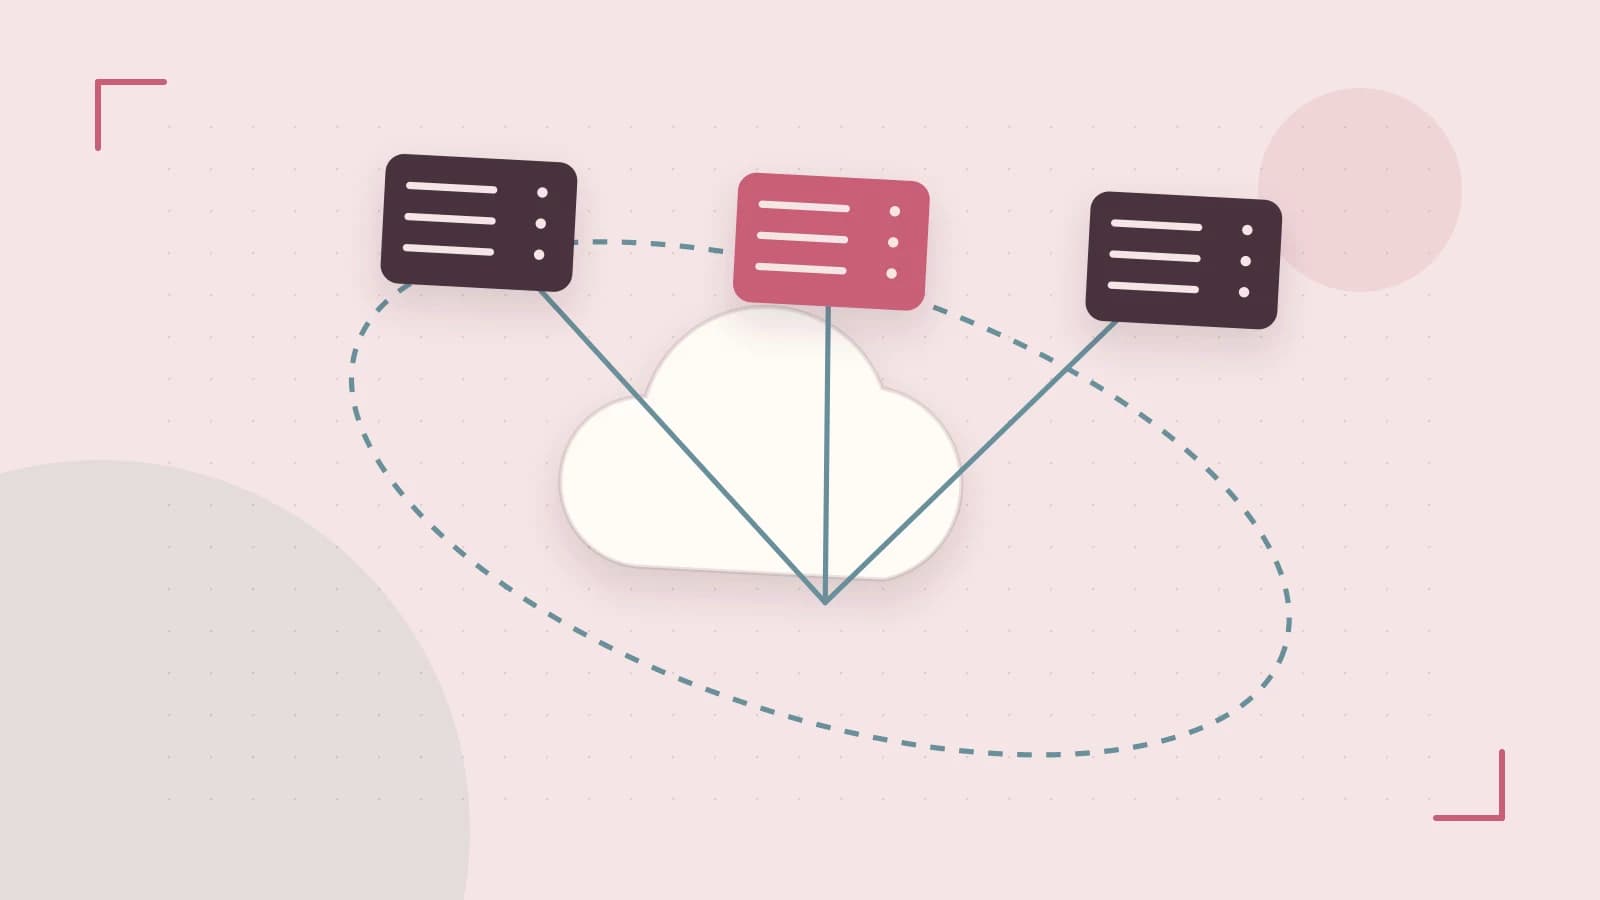
Head sampling drops traces before they're interesting
With head sampling, the SDK decides at the first span whether a trace lives or dies. It's cheap and simple, but the decision happens before the request completes. A trace that ends in a 504 gateway timeout has the same survival probability as a routine 200 OK. If you need to debug that timeout, you're out of luck -- the trace was already dropped.
Tail sampling keeps the whole story
Tail sampling in the OpenTelemetry Collector works differently. It buffers every span belonging to a trace until a decision window closes, then evaluates policies against the complete trace and forwards or discards it as a unit. You can keep 100% of traces with error status, 100% of traces slower than a latency threshold, and a small baseline of normal traffic. This means the traces you most want during an incident are the ones you preserve.
The routing requirement that's easy to miss
Tail sampling only works when all spans of a trace arrive at the same Collector instance. In a load-balanced deployment with round-robin OTLP routing, spans from one trace scatter across instances, each sees only a partial trace, and the sampler silently drops the incomplete trace. The fix is a two-tier setup: a front-tier load-balancing Collector that routes by trace ID to a stateful tail-sampling tier behind it.
A concrete configuration
Policy names and defaults shift across Collector versions, so verify this shape against the opentelemetry-collector-contrib tail sampling processor docs for your deployed version. Here's a configuration that keeps error traces, slow traces above 2 seconds, and a 5% baseline of normal traffic:
processors: tail_sampling: decision_wait: 10s num_traces: 50000 policies: - name: keep-errors type: status_code status_code: {status_codes: [ERROR]} - name: keep-slow type: latency latency: {threshold_ms: 2000} - name: baseline-5-percent type: probabilistic probabilistic: {sampling_percentage: 5} service: pipelines: traces: receivers: [otlp] processors: [tail_sampling] exporters: [otlp/backend]Policies are OR-ed: a trace matching any policy is kept. decision_wait is how long the Collector holds a trace's spans before deciding; num_traces caps how many traces sit in memory at once. Both directly bound memory usage.
- Memory: Every span is held until the decision. At high throughput with a 10-second wait, this is a real heap commitment. Watch the Collector's self-metrics for sampled vs. dropped spans and memory headroom under realistic load.
- Durability: Buffered spans live in RAM. A Collector crash or restart loses everything in the buffer. For telemetry this is usually acceptable, but it is a nonzero risk.
- Operational complexity: You now run a stateful routing tier. Trace-ID-consistent routing must survive scaling events and deploys.
- Backend interaction: Some vendors apply their own sampling downstream; stacking samplers can produce confusing effective rates.
When to use tail sampling versus head sampling
If your pain is 'we sampled away the exact trace that explains the outage,' tail sampling is the right tool and the routing tier is worth the extra moving parts. If your pain is only 'telemetry costs too much,' start with head sampling and rate limits -- simpler, cheaper, and often enough. Either way, verify the result empirically: check the Collector's own sampling metrics and confirm in your backend that error traces appear at the rate you expect, not the rate you configured.
 opentelemetry
0 replies
A thoughtful contribution can make all the difference. Be the first to share one.