Stopping the Leak: Tuning Tomcat JDBC and Executor Pools for High Concurrency
Learn how to prevent connection leaks and thread saturation in Tomcat by tuning the JDBC pool and Executor settings for high-concurrency environments.
22 Aug 2026, 21:43 UTC
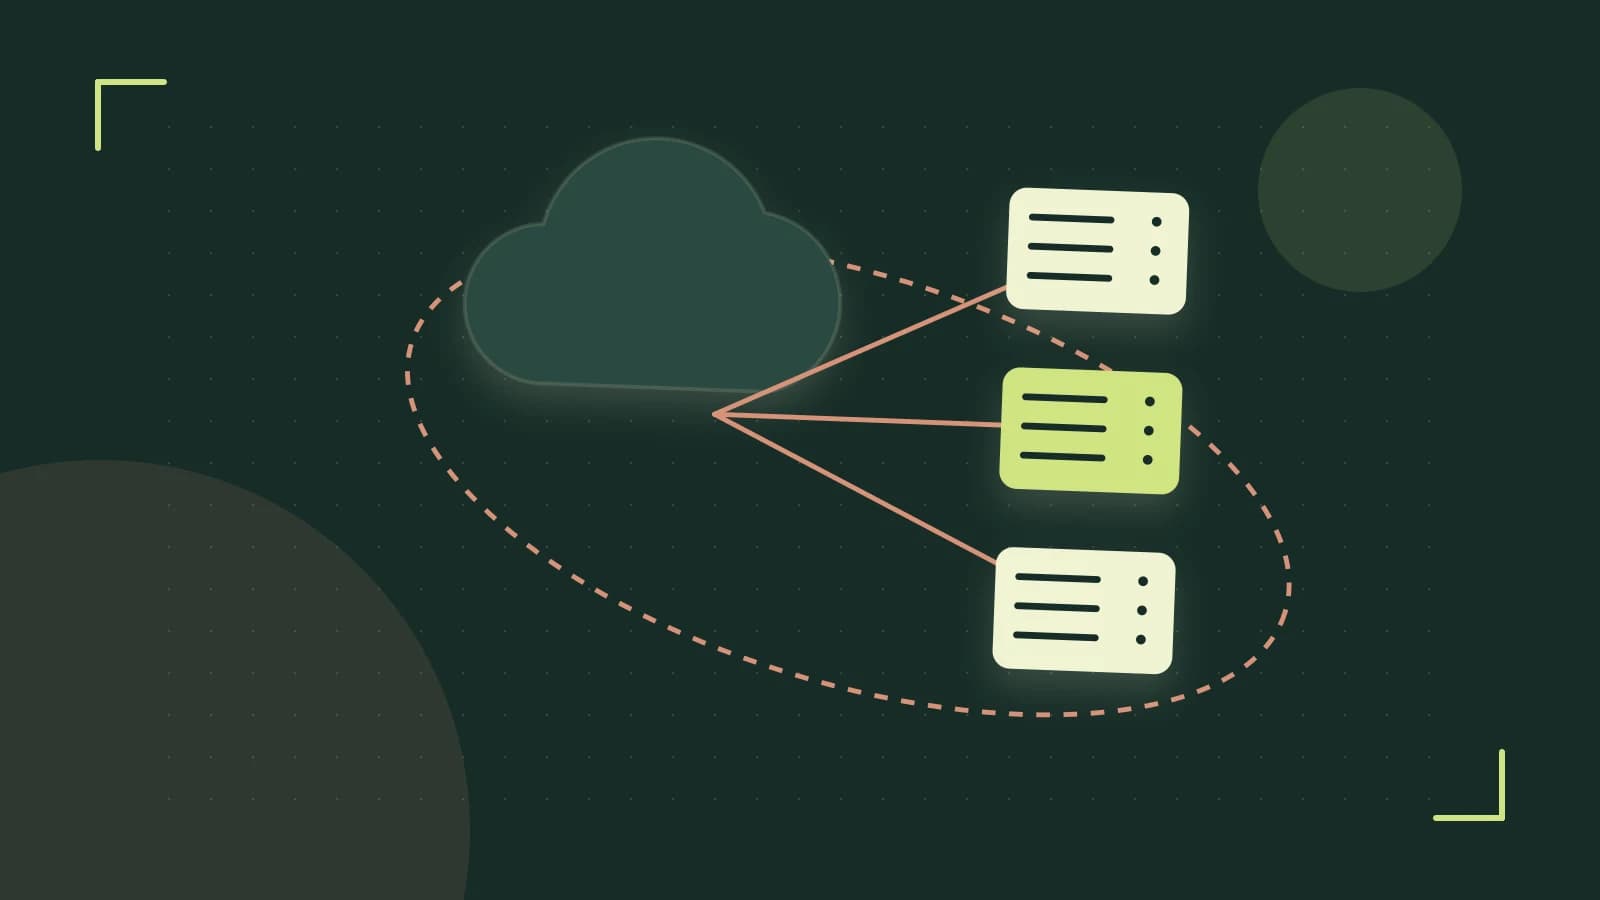
The Silent Resource Drain
A common failure mode in high-traffic Tomcat applications is the \"slow death\"—where a server gradually stops responding to requests despite low CPU usage. Often, the culprit isn't a lack of hardware, but a mismatch between the JDBC connection pool and the Executor thread pool. When connections leak or threads saturate, the application doesn't crash immediately; it simply stops accepting new work, leading to timeouts that are difficult to trace without specific telemetry.
Taming the JDBC Connection Pool
The Tomcat JDBC Pool is designed for performance, but its default settings are permissive. If your application fails to close a connection in a finally block due to an unexpected runtime exception, that connection remains \"active\" in the pool indefinitely. This is a connection leak.
To prevent this, you must enable abandoned connection removal. This allows Tomcat to reclaim connections that have been checked out for longer than a specified threshold, assuming they were leaked.
Critical JDBC Settings
- removeAbandoned: Set to
trueto enable the cleanup mechanism. - removeAbandonedTimeout: The number of seconds a connection can be out of the pool before it is considered abandoned. This must be longer than your longest legitimate database transaction.
- logAbandoned: Set to
trueto print a stack trace of the code that leaked the connection, which is essential for permanent fixes.
Offloading Work with the Executor
By default, Tomcat uses a basic connector that creates threads on demand. For high-concurrency environments, using a shared Executor (a dedicated thread pool) is more efficient. It decouples the acceptance of the TCP connection from the processing of the request.
The maxThreads attribute determines the ceiling of concurrent requests. However, increasing this number blindly can lead to excessive context switching—where the CPU spends more time swapping threads than executing code—and increased JVM memory pressure due to thread stack allocation.
Worked Example: server.xml Configuration
Below is a configuration for a high-concurrency scenario. This setup assumes Tomcat 9.x or 10.x. These changes are made in the conf/server.xml file. You will need administrative permissions to modify this file and restart the service.
<!-- 1. Define the Executor for thread management -->
<Executor name=\"tomcatThreadPool\"
          norminSpareThreads=\"20\"
          maxThreads=\"200\"
          prestartminSpareThreads=\"true\" />

<Service name=\"Catalina\">
    <!-- 2. Link the Connector to the Executor -->
    <Connector executorName=\"tomcatThreadPool\"
               port=\"8080\"
               protocol=\"HTTP/1.1\"
               connectionTimeout=\"20000\"
               acceptCount=\"100\" />

    <GlobalNamingResources>
        <Resource name=\"jdbc/TestDB\"
                  auth=\"Container\"
                  type=\"javax.sql.DataSource\"
                  maxActive=\"100\"
                  maxIdle=\"30\"
                  maxWait=\"10000\"
                  removeAbandoned=\"true\"
                  removeAbandonedTimeout=\"60\"
                  logAbandoned=\"true\" />
    </GlobalNamingResources>
</Service>
Configuration Risks
- AcceptCount: If
acceptCountis too high, requests will queue up in the OS TCP stack. Users will experience a \"hanging\" browser rather than an immediate 503 error, which can hide the fact that your server is overloaded. - Timeout Mismatch: If
removeAbandonedTimeoutis shorter than a heavy reporting query, Tomcat will kill the connection while the database is still processing, resulting inSQLException: Connection closed.
Verifying the Configuration
To confirm these settings are working, do not rely on application logs alone. Use JMX (Java Management Extensions) to monitor the JDBCConnectionPool MBeans. Specifically, track these three metrics during a load test:
- ActiveConnections: Should fluctuate but return to baseline after load drops.
- IdleConnections: Should stay near your
maxIdlesetting. - AbandonedConnections: Any value above zero indicates a leak in your application code that the pool is actively cleaning up.
If you see AbandonedConnections increasing, check your logs for the stack traces generated by logAbandoned=\"true\" to find the missing connection.close() call.
Trade-offs and Limitations
While a large maxThreads pool handles more concurrent users, it increases the JVM footprint. Each thread consumes memory for its stack (typically 1MB per thread). A pool of 1,000 threads can consume 1GB of RAM just for stack space, potentially triggering more frequent Garbage Collection (GC) cycles, which increases latency for all users.
Actionable Summary
To stabilize a high-concurrency Tomcat instance: first, implement an Executor to manage thread overhead. Second, enable removeAbandoned in your JDBC resource to prevent silent memory leaks. Finally, verify your maxThreads against your available RAM to ensure you aren't trading thread capacity for GC instability.
 tomcat
0 replies
A thoughtful contribution can make all the difference. Be the first to share one.