Speeding Up TensorFlow Training with tf.data: A Practical Pipeline for CIFAR‑10
Avoid GPU stalls by building a tf.data pipeline that prefetches and parallel‑maps data. Learn how to set up a CIFAR‑10 pipeline, tune prefetch buffers, and monitor GPU utilization to keep training fast and memory‑efficient.
30 Aug 2025, 08:33 UTC
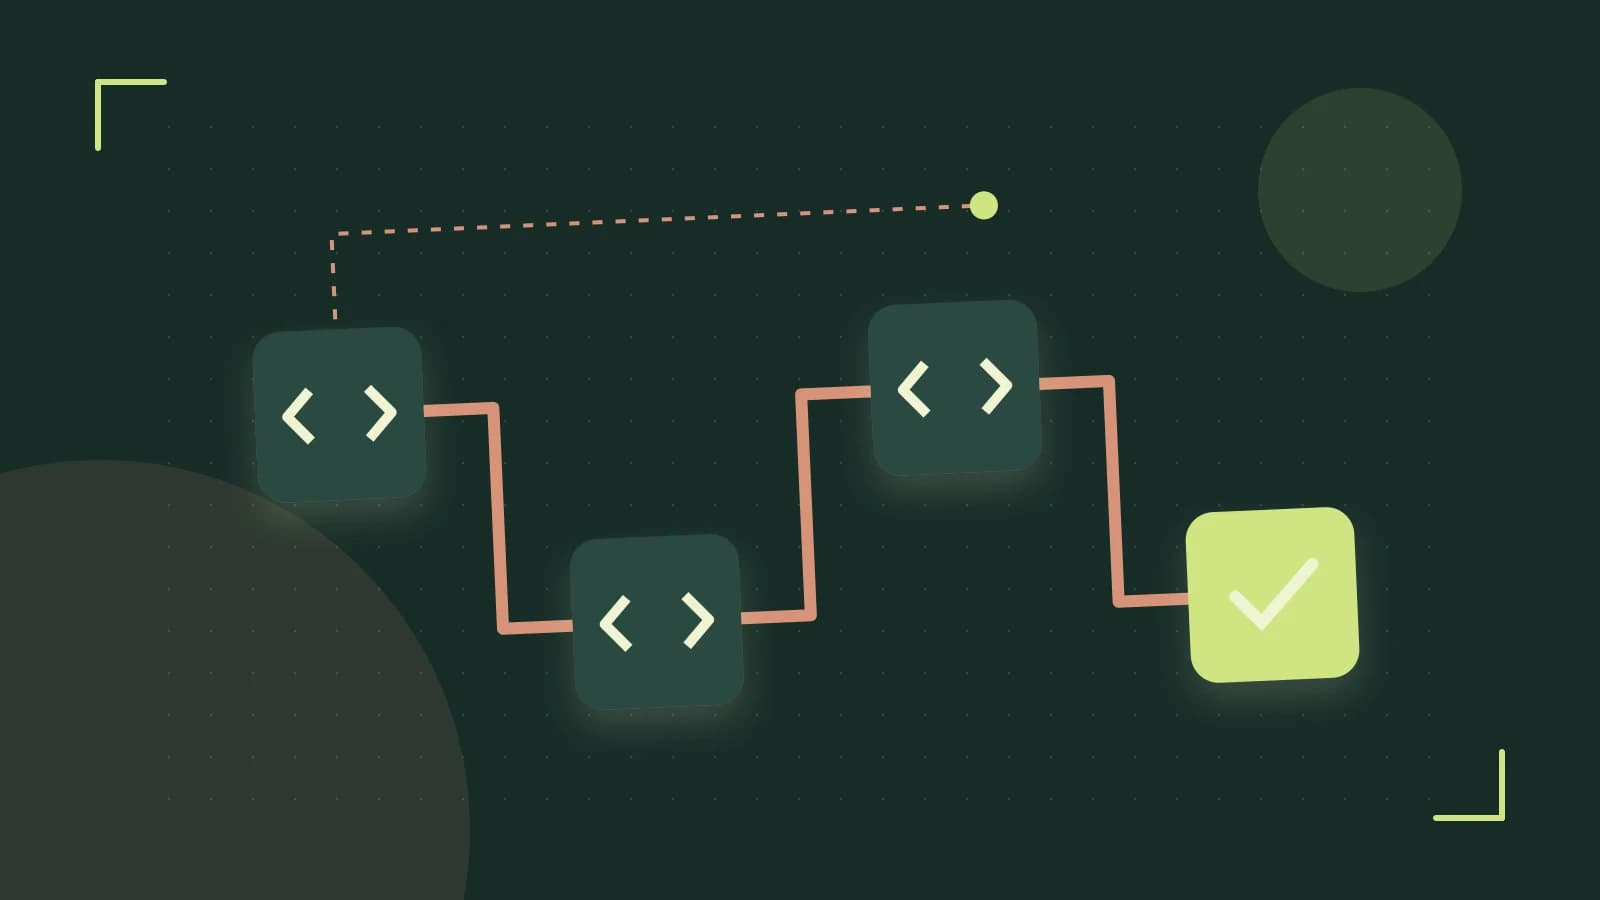
Problem: The GPU is Waiting for Data
When training deep neural networks, the GPU often sits idle while the CPU prepares the next batch of images. This is especially obvious on large‑scale datasets or when heavy augmentations are applied. The result is longer epochs, wasted compute, and a higher cost per training iteration.
Thesis: tf.data Makes Data Ready When the GPU Needs It
The tf.data API lets you declare a data pipeline that runs in parallel with the model. By using map for preprocessing, batch to group samples, and prefetch to queue the next batch, you can keep the GPU fed and the training loop smooth.
Building a CIFAR‑10 Pipeline
Below is a minimal, reproducible example. Replace YOUR_DATASET_PATH with the folder containing the CIFAR‑10 images or use the tf.keras.datasets.cifar10.load_data() helper.
# Run on a machine with the tensorflow package installed
import tensorflow as tf

# 1. Load raw data (here we use the built‑in dataset for illustration)
(x_train, y_train), _ = tf.keras.datasets.cifar10.load_data()

# 2. Wrap data in a tf.data.Dataset
train_ds = tf.data.Dataset.from_tensor_slices((x_train, y_train))

# 3. Define a preprocessing function (random flip + normalization)
@tf.function
def preprocess(image, label):
    image = tf.image.random_flip_left_right(image)
    image = tf.cast(image, tf.float32) / 255.0
    return image, label

# 4. Build the pipeline: map, batch, prefetch
batch_size = 128
train_ds = (train_ds
             .shuffle(buffer_size=10_000)
             .map(preprocess, num_parallel_calls=tf.data.AUTOTUNE)
             .batch(batch_size)
             .prefetch(tf.data.AUTOTUNE))

# 5. Iterate once to verify it works (no output shown)
for _ in train_ds.take(1):
    pass
Key points:
tf.data.AUTOTUNElets TensorFlow decide how many concurrent map workers and prefetch buffer size to use based on available CPU cores and memory.- Prefetching overlaps data loading with GPU execution; the default buffer size is usually enough for most workloads.
- Wrapping
preprocesswith@tf.functioncompiles it into a graph, improving speed and ensuring it can run in parallel.
Measuring the Impact
Use TensorBoard’s profiler to compare epoch times before and after adding prefetch:
- Start TensorBoard pointing at the log directory:
tensorboard --logdir=./logs. - Run training with
tf.profiler.experimental.Profileenabled. - Check the GPU Utilization tab; a steady 80‑100% indicates the GPU is rarely idle.
On a typical NVIDIA GPU, you should see a reduction in epoch time of 20‑40% after adding prefetch, depending on the dataset size and augmentation complexity.
Trade‑Off: Memory vs Speed
Prefetching keeps a buffer of ready batches in host memory. If you set a large prefetch value or use a huge batch size, you risk exhausting RAM, leading to out‑of‑memory (OOM) errors. Monitor host memory with top or free -h during training. A quick sanity check:
# On Linux, monitor memory while training
watch -n 1 free -h
Adjust the prefetch buffer or batch size if you notice the memory usage approaching the machine’s limit. A common compromise is prefetch(2) or prefetch(tf.data.AUTOTUNE) combined with a batch size that keeps the per‑GPU memory usage under 80%.
When tf.data Might Not Be Enough
If your preprocessing relies heavily on Python side‑effects (e.g., writing logs, calling external APIs), the map function may not execute as expected inside a tf.function graph. In such cases, keep the preprocessing in pure TensorFlow ops or move side‑effects outside the data pipeline.
Actionable Checklist
- Wrap your dataset with
tf.data.Dataset.from_tensor_slicesor a custom loader. - Apply
shuffleearly to ensure randomness. - Use
mapwithnum_parallel_calls=tf.data.AUTOTUNEfor preprocessing. - Batch your data with the size that fits your GPU memory.
- End with
prefetch(tf.data.AUTOTUNE)to overlap I/O and compute. - Profile GPU usage and host memory; iterate on buffer sizes if necessary.
By following these steps, you’ll turn a stalled training loop into a high‑throughput pipeline that keeps your GPU busy and your experiments running faster.
 tensorflow
0 replies
A thoughtful contribution can make all the difference. Be the first to share one.