Diagnosing Infinite Rerender Loops in Ember Components
A diagnostic workflow for Ember apps that freeze or throw 'Maximum call stack size exceeded': identify circular tracked-state writes with the profiler and Ember Inspector, then apply guarded writes and single-source-of-truth fixes.
01 Feb 2026, 15:57 UTC
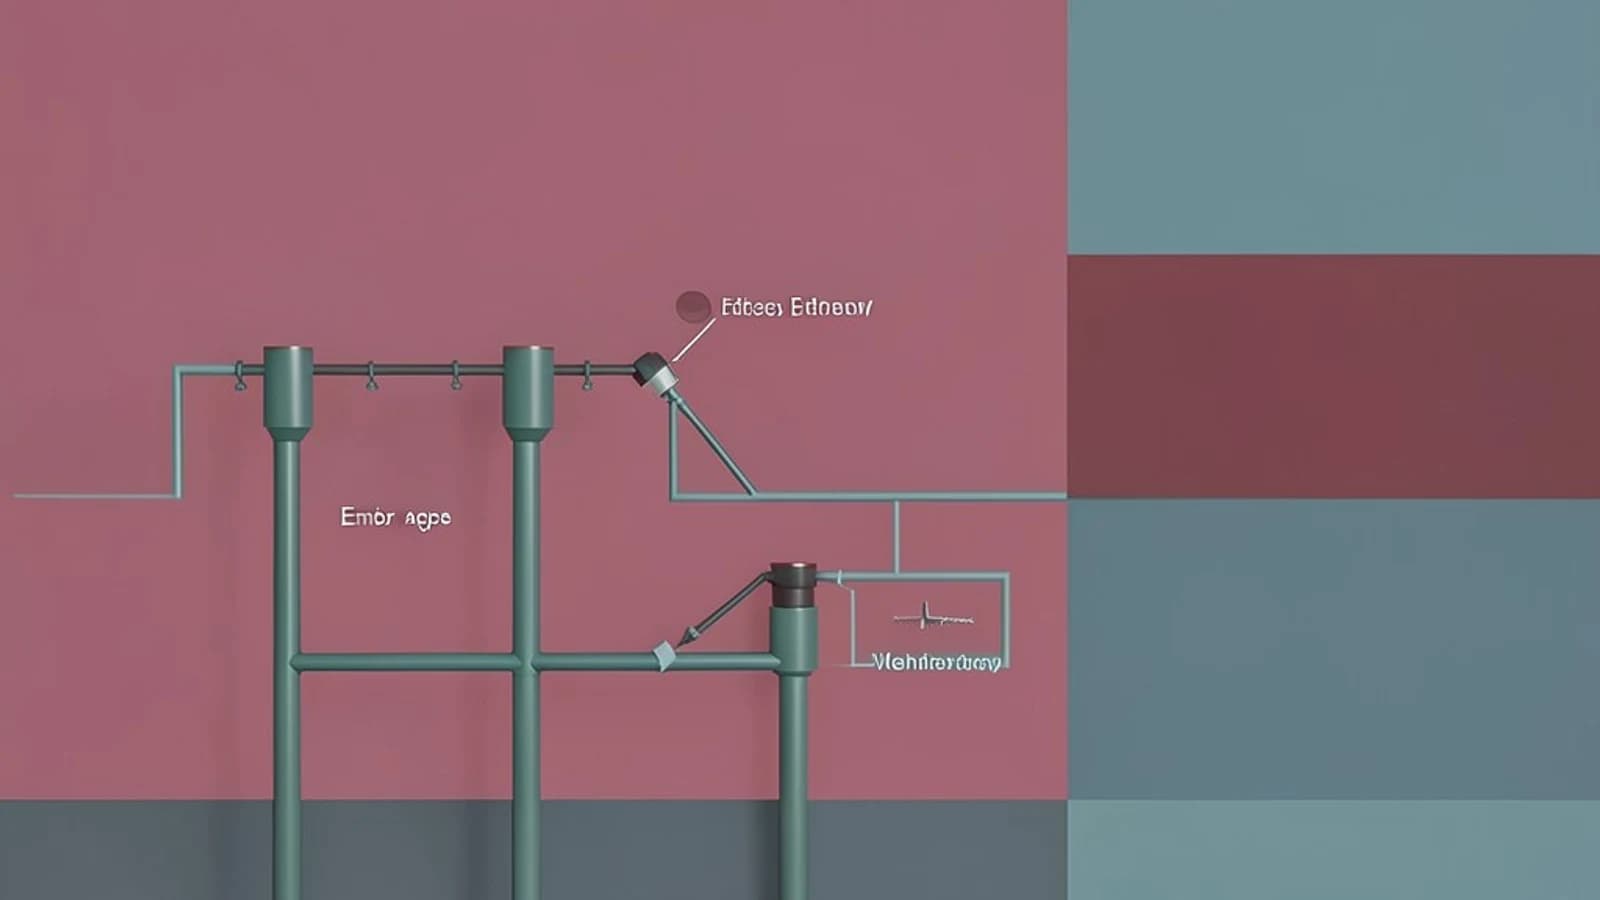
Recognizing the condition
Your Ember app freezes during a specific interaction, the tab's CPU usage spikes, and the browser console eventually reports Maximum call stack size exceeded or the page simply stops painting. The common thread: a component update is triggering another update to the same state, and the render loop never settles. This is a data-flow bug, not a rendering-engine bug — Ember's Glimmer VM is doing exactly what your code asks, forever.
The good news is that these loops have a small set of recurring causes, and you can usually isolate the culprit in one debugging session. This guide assumes Ember Octane or later (3.15+, including 4.x/5.x), where @tracked properties and native getters are the norm. Notes on legacy patterns are included where they still appear in older codebases.
Likely causes at a glance
| Symptom | Probable cause | Where to look |
|---|---|---|
| Stack overflow on first render | A getter mutates tracked state it (transitively) depends on | Component class getters |
| Loop only after user interaction | An action writes state that re-triggers the same action | Action handlers, modifiers |
| Property flapping between two values | Two components/services writing to each other's source | Ember Inspector Data tab |
| Loop in classic components only | didUpdate / didReceiveAttrs calling set() unconditionally | Lifecycle hooks |
| Intermittent, hard to reproduce | Mixing computed and @tracked in one dependency chain | Cross-layer property definitions |
Ordered checks
1. Capture the loop in the Performance profiler
Open your browser's DevTools, start a Performance recording, trigger the interaction, and stop after a few seconds (before the tab dies, if possible). Look for a repeating "sawtooth" of the same function frames — typically your getter or action, then Ember's rendering internals, then your code again. The repeating frame names tell you which property or method is involved. This is the fastest way to get a suspect before reading any code.
2. Watch the property in Ember Inspector
With the Ember Inspector browser extension, open the component tree, select the suspect component, and watch its arguments and tracked state. A value that visibly toggles or increments without further input confirms a circular write. If the Inspector itself becomes sluggish, that is also a signal — it polls the same run loop that is spinning.
3. Audit the template for method calls
Search the component's template for bare method invocations used as values, for example:
<p>Total: {{this.calculateTotal}}</p>If calculateTotal is a plain method (not a getter), it runs on every render. That alone is wasteful but not a loop — it becomes a loop when the method also writes tracked state, directly or via a side effect such as logging to a tracked store. Convert it to a getter so Glimmer caches it against its tracked dependencies:
get total() {
  return this.items.reduce((sum, i) => sum + i.price, 0);
}
and reference it as {{this.total}}. The DOM now updates only when this.items actually changes.
4. Audit lifecycle hooks and modifiers
In legacy class components, look for didUpdate, didReceiveAttrs, or didInsertElement that call this.set() without a guard. In modern code, check custom modifiers that write to tracked properties in their install/update logic. Any write inside a render-or-post-render hook that feeds back into what triggered the hook is a loop by construction.
5. Check for two-way writes across boundaries
A subtler variant: component A's action updates a service property; a getter in component B derives from it and writes back to a different property that A consumes. No single component looks wrong. The profiler's repeating frames will span two files — that's your tell.
Fixes tied to findings
If a getter or method mutates state
Make getters pure. Move the write into an explicit action triggered by a user event or a well-defined lifecycle point. If the write exists to normalize derived data, compute the normalized value in the getter instead of storing it.
If an action re-triggers itself
Add a guard clause so no-op writes exit early. Tracked properties already skip downstream invalidation when a set value is strictly equal, but guards matter for objects/arrays (new identity each time) and for actions with side effects:
@action
updateSelection(next) {
  if (next === this.selected) return;
  this.selected = next;
}
For object values, compare a stable key (next.id === this.selected?.id) rather than identity.
If two components write to each other
Pick a single source of truth — usually the service or the parent component — and make the other side read-only, receiving the value as an argument. Data down, actions up. Circular loops almost always dissolve once one direction of the circle is removed.
If legacy and modern reactivity are mixed
A computed property depending on a @tracked property (or vice versa) works, but it obscures which write started the cycle. Migrate the chain to one model — preferably @tracked plus native getters — before debugging further. Also note that in Octane+ you should assign tracked properties directly (this.x = y); using set() on them is unnecessary and can mask intent.
Verifying the fix
Reproduce the original interaction with the Performance profiler running: the sawtooth pattern should be gone, replaced by a single render burst per interaction. In Ember Inspector, confirm the suspect property settles to a stable value after one update. As a regression net, an acceptance test that performs the triggering interaction and asserts the final DOM state will fail by timeout if the loop returns.
When to escalate
Escalate beyond component-level debugging when: the repeating profiler frames live entirely in framework internals with no app code (possible version bug — check the Ember changelog and GitHub issues for your exact version); the loop only occurs under FastBoot/server-side rendering (different rehydration semantics); or the cycle spans an addon you don't control (wrap its API behind your own service with guarded writes, and file an upstream issue). In all three cases, a minimal reproduction in a fresh ember new app is the artifact that gets the issue resolved.
 ember
ember0 replies
A thoughtful contribution can make all the difference. Be the first to share one.