Azure Application Insights: connect request failures to the dependency that caused them
Use Application Insights request and dependency telemetry to investigate failures, with clear service identity, bounded log queries and verified instrumentation.
11 Oct 2026, 08:39 UTC
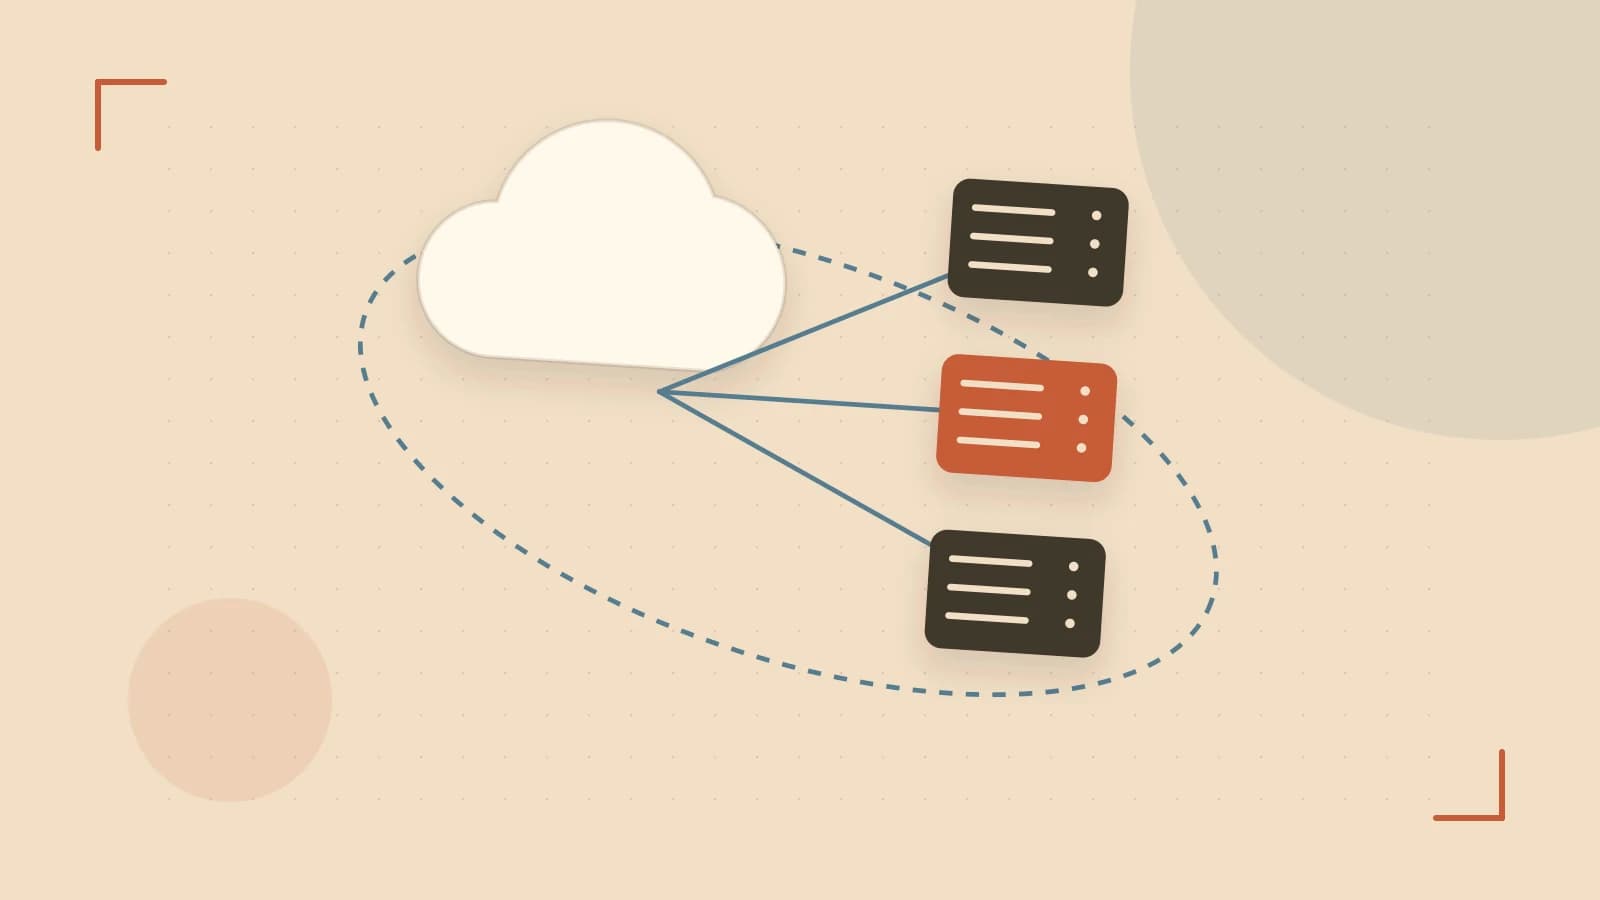
Instrument the application path you need to explain
Application Insights is Azure Monitor's application performance monitoring capability. For supported applications, OpenTelemetry provides a standard way to collect telemetry that can be analyzed there. Start with the service's important request paths and dependencies. A large volume of logs is less useful than a request trace that identifies where the actual delay or failure occurred.
Use the current supported instrumentation guidance for the application's runtime and hosting model. Auto-instrumentation support and SDK setup differ across environments. Confirm which component collects requests, outgoing dependencies and exceptions, and avoid installing overlapping instrumentation without checking for duplicate telemetry.
Give each service a stable identity
A distributed application can contain a web service, a queue worker and scheduled jobs. Give those components distinct, stable service identities so their telemetry is understandable. Keep deployment version and environment metadata safe and bounded. A production trace should not be confused with a development test because both processes used the same default name.
Propagation connects a request to the downstream calls it triggers. Verify it across the actual boundaries, including supported HTTP clients and messaging integrations. A request that appears successful while a background effect later fails needs another observable stage; tracing a web response alone cannot describe the entire business operation.
Verify instrumentation with a small known flow
- Choose one representative request with a known dependency call.
- Confirm the request appears under the intended service and environment.
- Inspect its dependency duration, result and correlation with the request.
- Trigger a controlled non-sensitive failure in development and inspect its telemetry.
- Check that useful diagnostics do not include tokens, credentials or private payloads.
A configured connection string does not prove the telemetry path works. Inspect the actual collected request and dependency. Check the runtime's exporter behavior, endpoint reachability and configuration. Use a small diagnostic request whose result is known so missing or duplicated telemetry is easy to identify.
Query a bounded time window first
Azure Monitor log queries are more efficient when they restrict time and filter early. Start with the incident interval and the affected service or operation before expanding the search. A query over every table and the full retention period can be slow and can make an incident harder to interpret. Choose columns that answer the diagnostic question.
Telemetry is evidence with collection limits. Sampling, retention and instrumentation coverage can affect what appears in a query. Interpret counts according to the configured collection behavior and distinguish a missing event from proof that the application never executed it. Pair traces with durable business-operation records where completeness matters.
Turn an incident into a measurable alert
After identifying the failing dependency or operation, define an alert that represents user impact: failed requests, sustained latency or unfinished work. Review its threshold and routing against expected workload variation. Keep a runbook that links the signal to the bounded query and the next diagnostic check. Monitoring is useful when it guides a concrete recovery decision.
References
- Application Insights OpenTelemetry observability overview - Azure Monitor — Microsoft Learn
- Optimize log queries in Azure Monitor - Azure — Microsoft Learn
 azure
azureSources & further reading
0 replies
A thoughtful contribution can make all the difference. Be the first to share one.